
The Richest Grandparents in History and the Youngest Families Going Backwards: Inside the Fed’s 2025 Wealth Survey
Published:
All figures are from the Federal Reserve’s 2025 Survey of Consumer Finances (released October 9, 2026; 4,367 families interviewed by NORC, April-December 2025), stated in 2025 dollars, so every change cited is a real, inflation-adjusted change. Wealth concentration figures are from the Fed’s quarterly Distributional Financial Accounts. This is data analysis, not financial advice.
Every three years, the Federal Reserve conducts the closest thing America has to a wealth census. The 2025 edition landed on October 9, and its headline is soothing: median family net worth of $215,900, up 2% in real terms; mean net worth of $1,241,500, up 7%. Median family income rose 7% to $82,200 while mean income actually fell 6% — income inequality, by that measure, narrowed slightly.
Read one layer down and the survey becomes the most two-sided document the Fed has published in years. Between 2022 and 2025, the groups that usually hold wealth got wealthier, and the groups that usually don’t, lost ground — in the Fed’s own carefully flat wording, changes “largely reinforced existing patterns of wealth inequality.” Here is what the tables actually say.
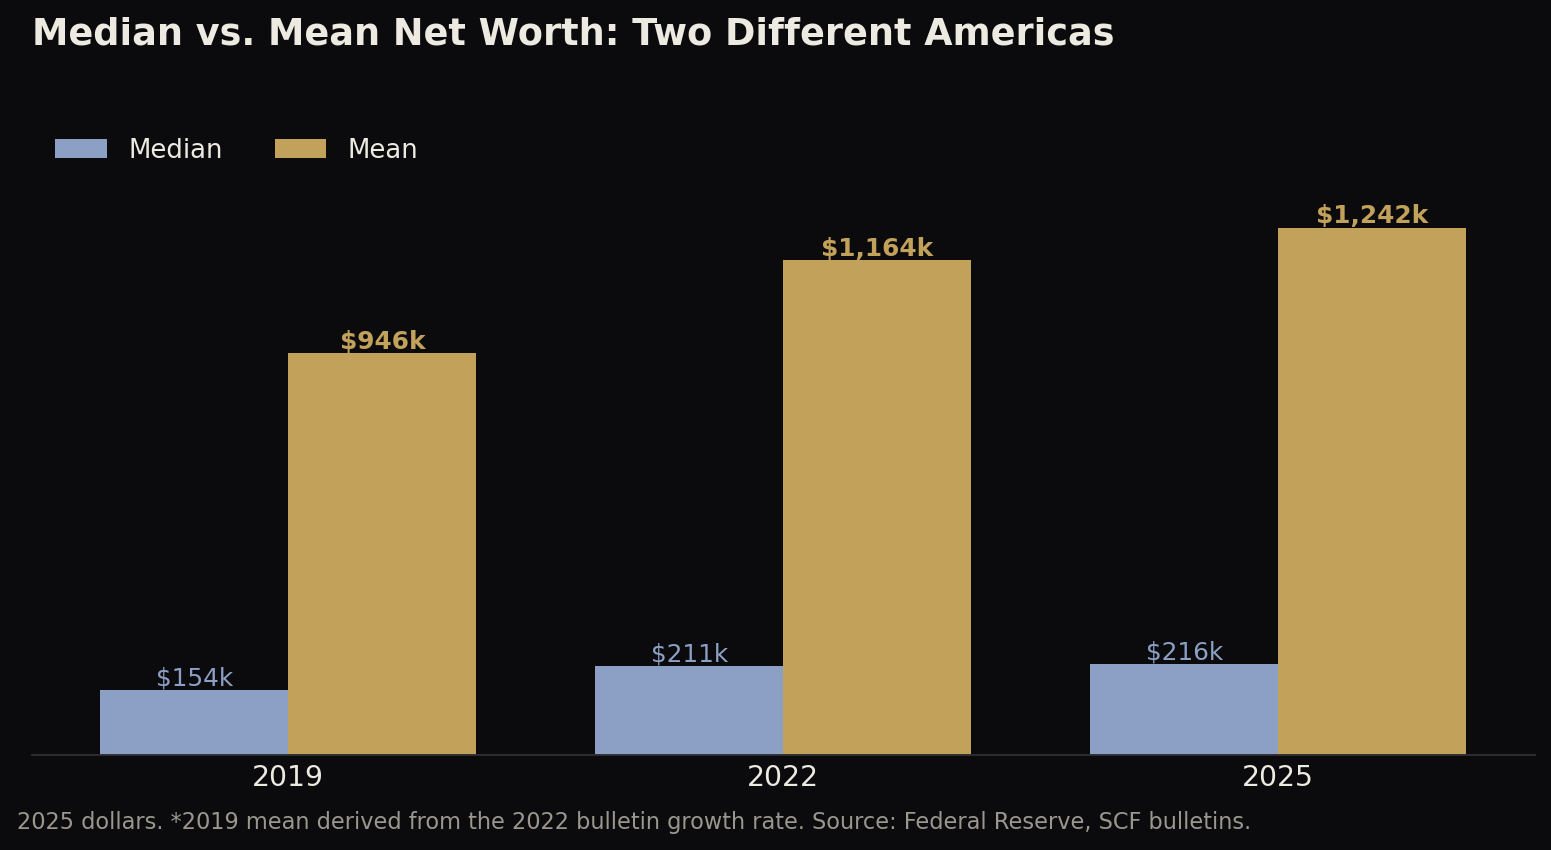
Two reference points before the details. First, the pace: from 2019 to 2022, median net worth surged 37% — the largest three-year gain in modern SCF history, powered by stimulus, housing, and a roaring market. The 2022→2025 gain of 2% is what normal looks like after an abnormal three years. Second, the median-mean gap: the mean ($1.24M) is 5.7 times the median ($215,900), a reminder that “average” American wealth is a statistic about the top of the distribution, not the middle.
The generational reversal
The single most striking table in the bulletin is the one by age. Families under 35 saw median net worth fall 23%, to $33,000 — and their mean fell 33%. Families aged 75 and older saw median net worth rise 37%, to $504,900, overtaking the 65–74 group to become, for the first time in the modern survey, the richest age group in America.
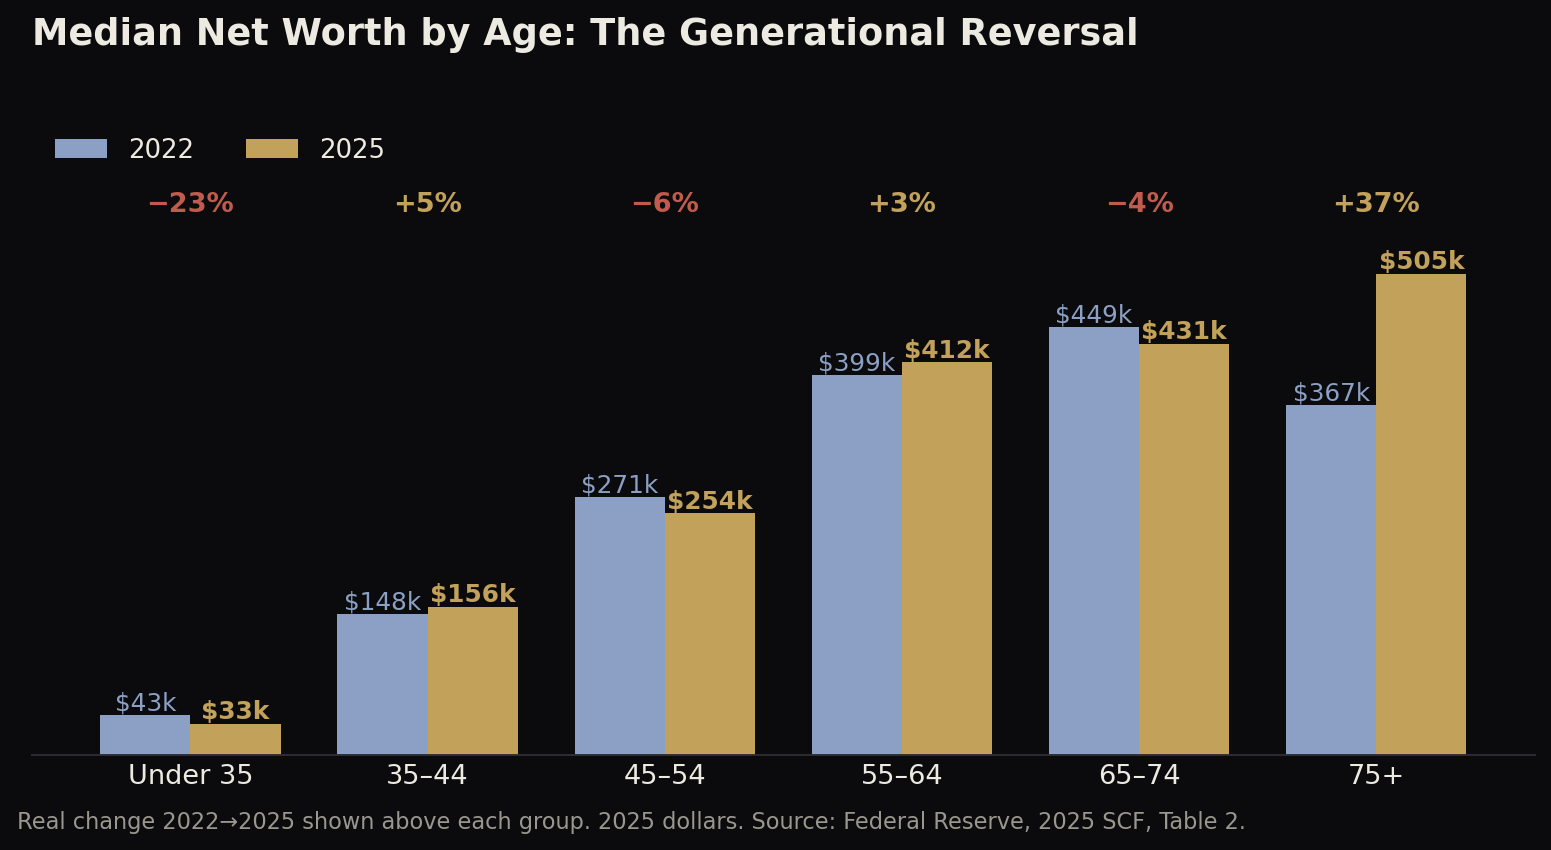
The Fed offers mechanisms for both ends. The young families’ 2019–2022 gains were unusually concentrated in business equity, and that is what unwound. The oldest families’ gains were driven primarily by rising retirement-account values — decades of compounded contributions meeting a strong market, in households whose housing is largely paid off. Wealth in 2025 America is, more than at any point in the survey’s history, a function of how long you have owned assets.
The racial gap widened — unevenly
Median net worth rose 6% for White families (to $332,100), 18% for Hispanic families (to $79,600), and 16% for Asian families (to $677,600, the highest of any group, broken out separately for the first time). For Black families, the median fell 25%, to $36,800 — reversing much of the roughly 60% surge recorded between 2019 and 2022.
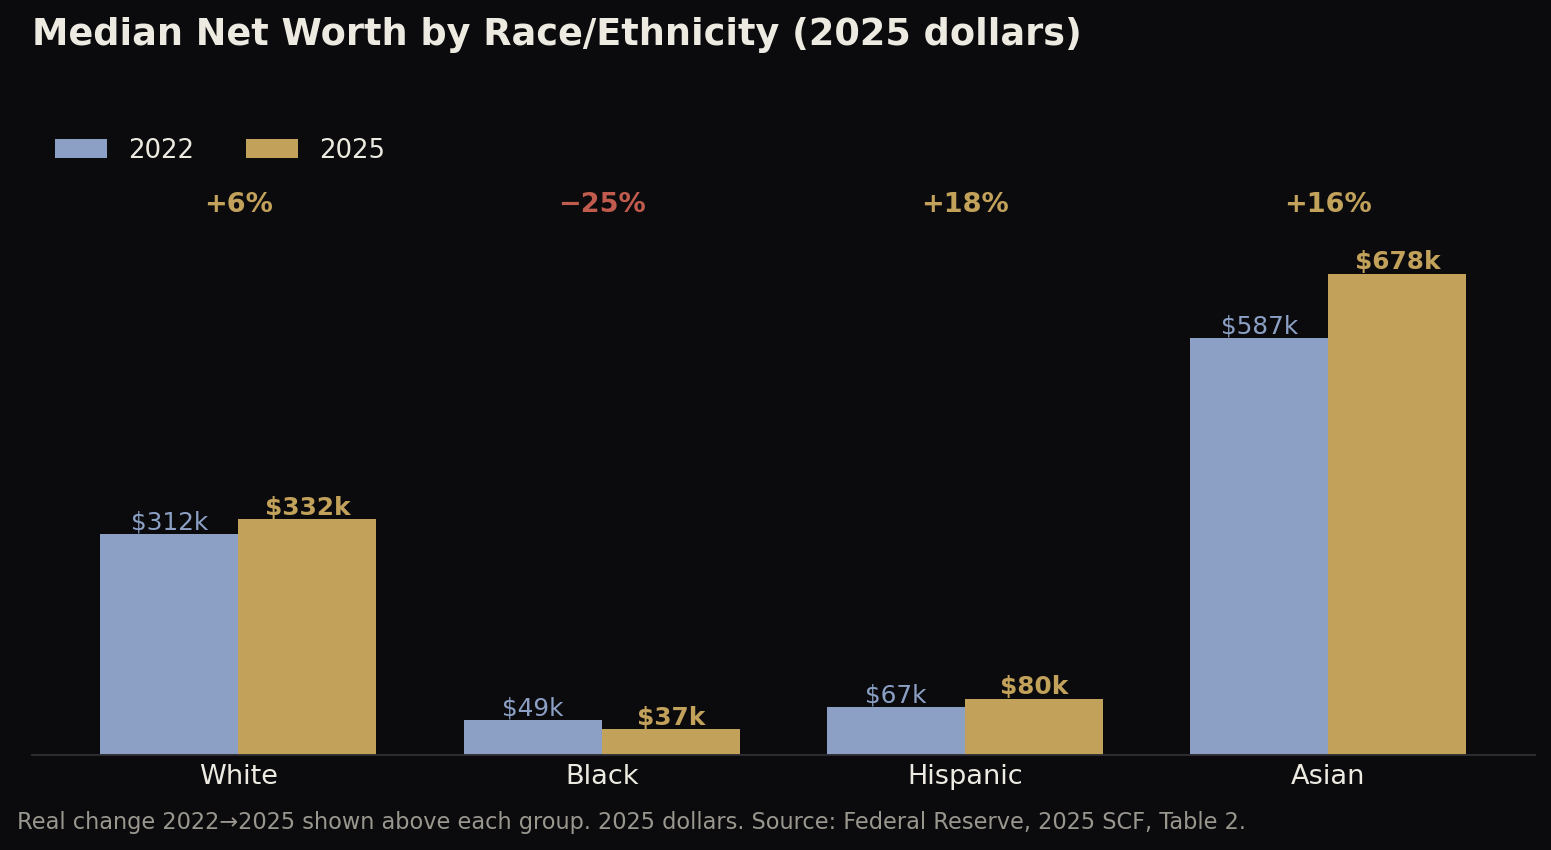
The result: median White wealth is now about 9 times median Black wealth — the largest ratio since 2016 — while the White–Hispanic ratio, at a bit more than 4 to 1, is the smallest on record. In dollar terms the White–Black median gap is roughly $295,300. Note also the shape inside the Black distribution: the median fell 25% while the mean rose 5%, meaning inequality widened within the group even as its center dropped. The pattern across groups is consistent with the survey’s master theme — families holding appreciating assets (homes, retirement accounts, businesses with durable equity) pulled ahead; families whose balance sheets are mostly wages and a bank account did not.
Education tells the same story with a cliff edge. Families whose reference person has no high school diploma saw median net worth collapse 55% to $18,600 — the largest decline for any group in the modern SCF — while their mean rose 53%, again a within-group split. High school graduates fell 9% at the median; “some college” families gained 21%; college graduates were flat (−1%) at $505,400. And by income, the top decile’s median net worth jumped 31% to $3.67 million, while the bottom income quintile slipped 6% to $14,400. At the very bottom of the wealth distribution, the bottom quartile’s median net worth is $1,700, and its mean is negative (−$4,300): the typical balance sheet there is a small pile of debts. Renters, as a group, have a median net worth of $10,600 against homeowners’ $458,900.
Concentration: the top 1 percent at a record
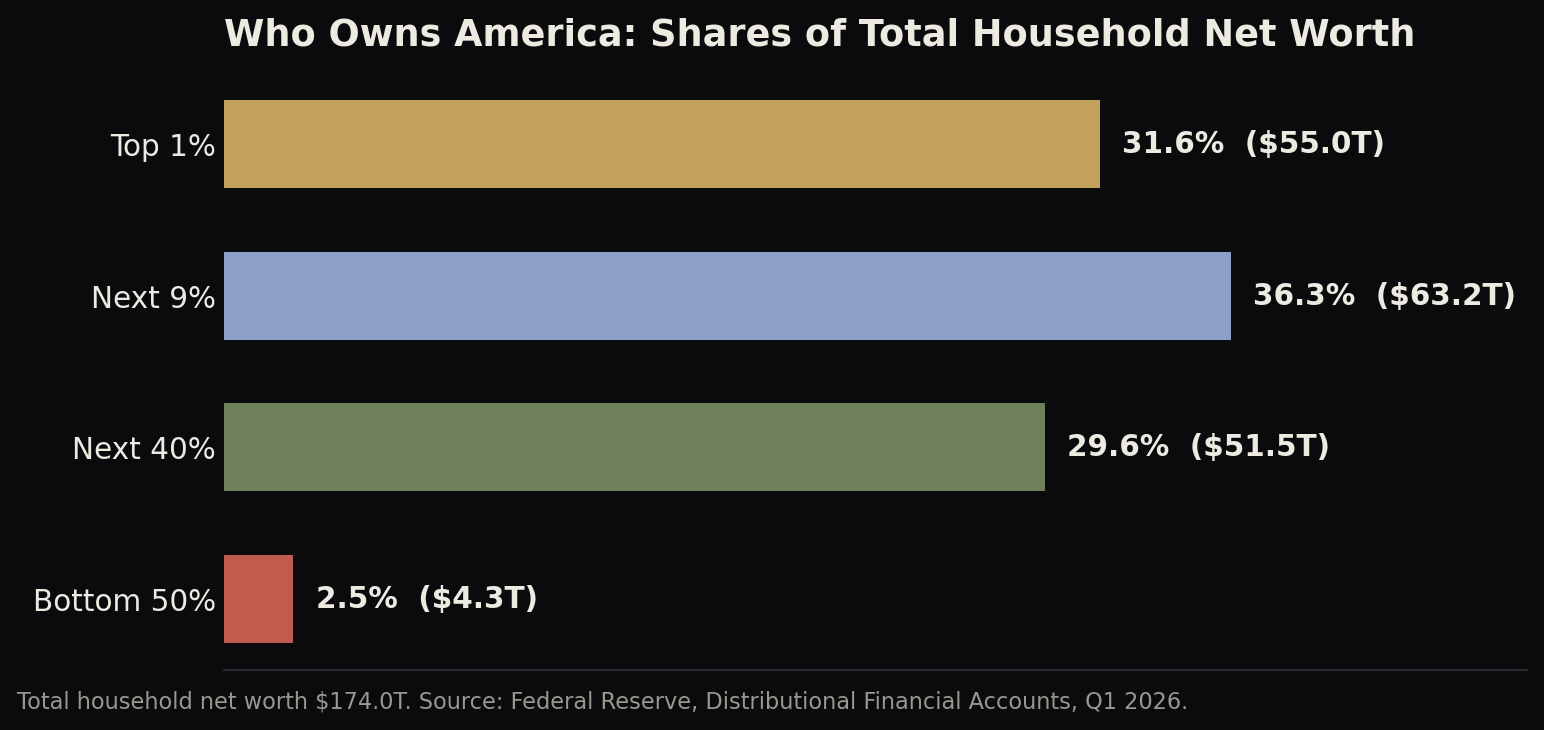
The SCF is triennial; for the current snapshot of concentration, the Fed’s quarterly Distributional Financial Accounts (benchmarked to the SCF) put total household net worth at $174.0 trillion in Q1 2026. The top 1% held 31.6% of it — and in Q4 2025 the share touched 31.8%, the highest in a series that begins in 1989. The top 1% also holds about half of all corporate equities and mutual fund shares; the bottom half of the country holds 2.45% of net worth and about 1.1% of equities.
What families own
The household balance sheet, per the survey, in one diagram:
Housing remains the middle class’s balance sheet. The homeownership rate was essentially flat at 65.6%. The median home was worth $375,000 (+6%), and median net housing value — the home minus the mortgage — rose 5% to $230,000. But the flow side of housing has never been worse in the survey’s data: the modeled monthly payment on the median home (30-year fixed at market rates, 80% loan-to-value, plus property tax) reached 33% of median monthly family income, an all-time high, up from 26% in 2022, driven mostly by mortgage rates (4.2% in March 2022 to 6.7% in March 2025). Owners got richer; the door in got more expensive. Both statements are the same statement.
Retirement accounts did the quiet compounding. Participation among families headed by someone 64 or younger edged up to 65.1%. Among the 54.9% of families holding an account, the median balance rose 11% to $106,000 and the mean 23% to $451,100 — the engine behind the 75+ group’s surge.
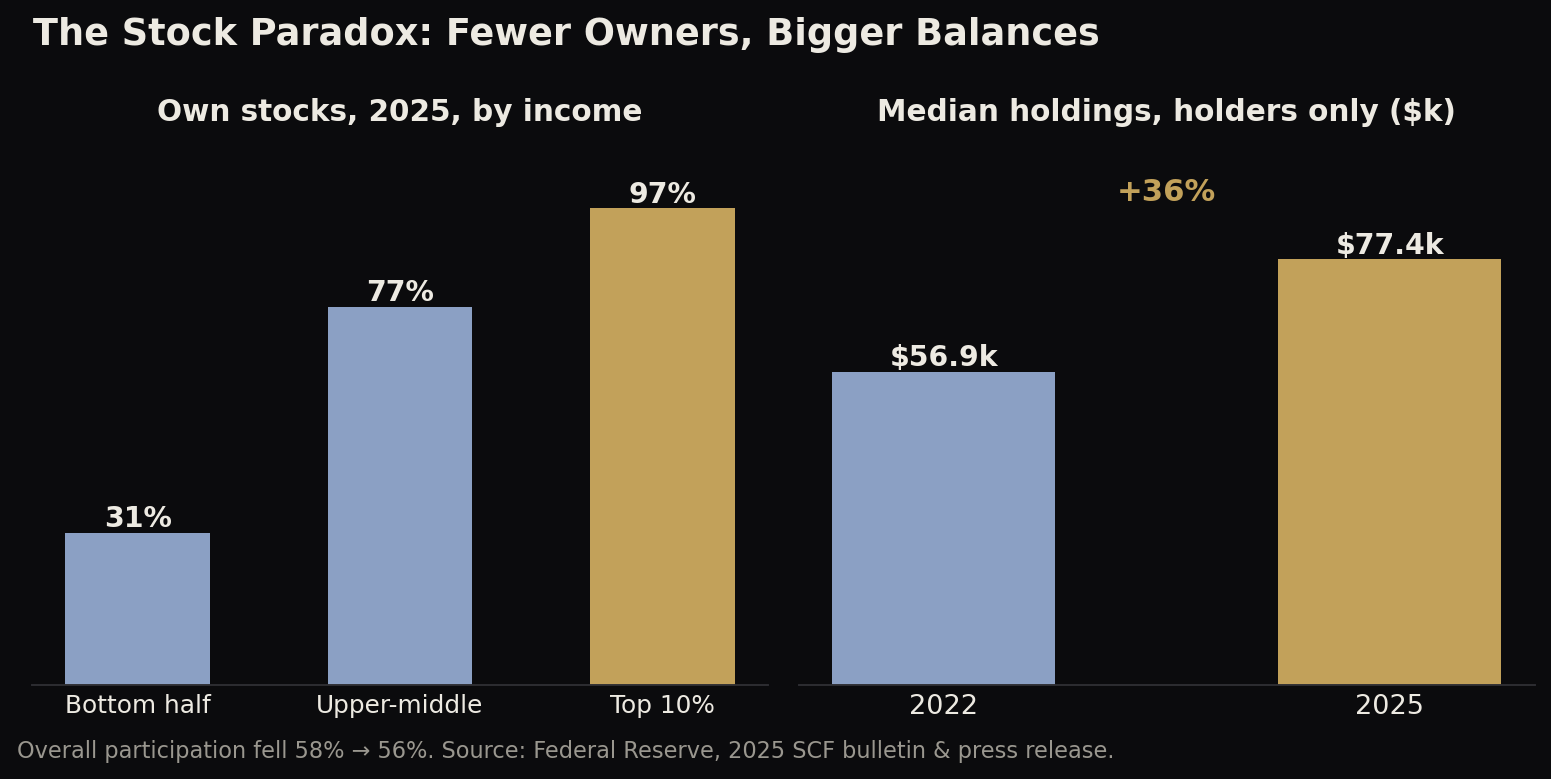
Stocks produced the survey’s neatest paradox. Participation fell, from 58% to 56% of families — driven almost entirely by families outside the top income decile — while the median holder’s portfolio rose 36% to $77,400. By income, ownership is 31% for the bottom half, 77% for the upper-middle, and 97% for the top decile. The market’s three-year run made owners richer and the ownership tent slightly smaller at the same time.
The dark side: payments, not balance sheets
Here is the finding that should temper any “households are fine” reading. The share of families late on a loan payment in the past year jumped from 12.2% to 19.6% — the worst reading since the 2010 survey, in the aftermath of the Great Recession. The share late by two months or more rose from 4.9% to 8.2%. The share of debtors whose payments exceed 40% of income rose from 6.5% to 8.6%, also the highest since 2010. Buy-now-pay-later balances doubled as a share of families, from 7% to 12%.
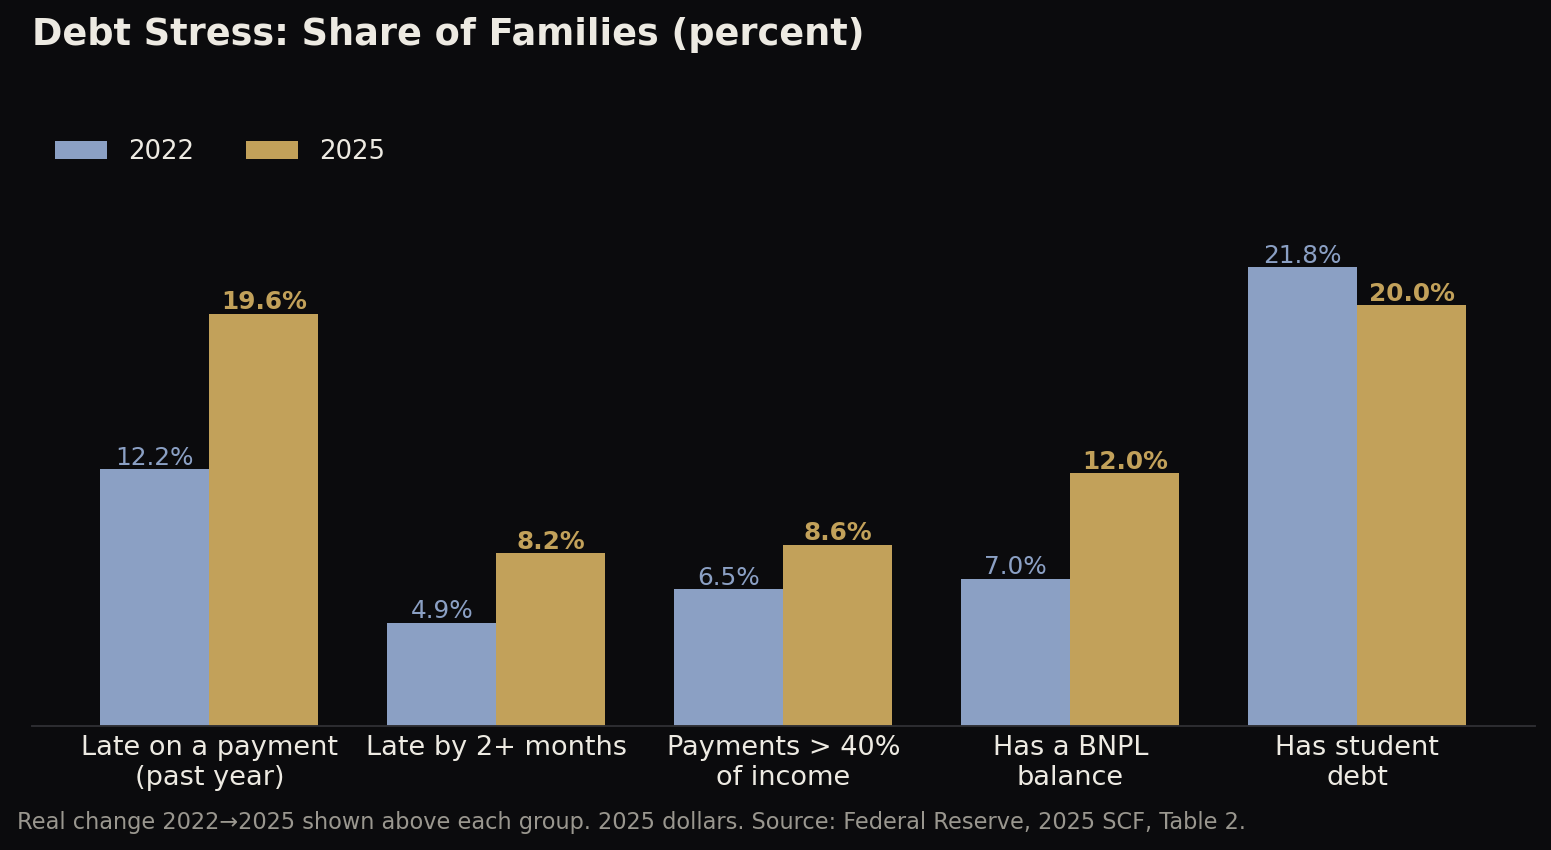
And yet the stock measures of debt look calm: median debt among debtors was flat at $88,100, the median debtor’s leverage ratio improved to 26.9% of assets, and aggregate leverage fell to 10.0%. The reconciliation is the interest-rate regime. Balances did not explode; the price of carrying them did — the average credit card APR in the Fed’s cited market data went from 14.6% to 21.4%, auto loans from 4.9% to 7.7%. Median credit-card balances barely moved ($3,100, +5%) while the mean rose 19% to $8,000 — a minority carrying much more, at much higher rates. Student debt was the one relief valve: the share of families holding it fell to 20.0%, and median balances declined 5% to $25,600.
This is a cash-flow squeeze sitting on top of an intact balance sheet — stress concentrated in exactly the groups (young, renting, less-educated) whose wealth lines in this survey point down.
My read
Five things this survey establishes, taken together:
- The broad-based wealth surge is over. 2019–2022 lifted nearly every median in the book (+37% overall). 2022–2025 sorted households by one variable — whether they owned appreciating assets — and paid out accordingly.
- Income and wealth decoupled. Wages compressed (median income +7%, mean −6%, with gains at the bottom and middle), while wealth diverged. A household can be doing better on pay and worse on wealth in the same three years; millions were.
- The generational ladder tilted. The richest age group in America is now 75+. The under-35 median fell by a quarter in real terms while the modeled payment on a median home hit a record 33% of median income. The first rung is not just higher — it is moving up faster than young balance sheets.
- Fragility is a payments problem, for now. Leverage ratios say households are not over-borrowed; delinquency at post-Great-Recession highs says a fifth of them cannot service what they have at 2025 interest rates. Which of those two facts wins depends on rates and employment, not on anything in this survey.
- Equity wealth effects are narrow at the top. With the top 1% holding roughly half of all equities and the bottom half holding about 1%, market rallies since 2022 were, in distribution terms, a top-decile event — which is precisely what the SCF’s group tables record.
One neighboring statistic to keep straight, because it will be quoted alongside this survey: the widely cited “$400 emergency expense” number is not from the SCF. It comes from the Fed’s separate SHED survey (May 2026), which found 63% of adults could cover a $400 emergency in cash or its equivalent. Different survey, different question — the SCF’s own fragility gauges are the late-payment figures above, and they are worse.
Sources: Federal Reserve press release — 2025 SCF results (Oct 9, 2026) · Aladangady et al., Changes in U.S. Family Finances from 2022 to 2025, SCF bulletin (Oct 2026) · Federal Reserve, Distributional Financial Accounts, Q1 2026 · Reuters — Fed says household income, wealth, debt stress rose from 2022 to 2025 (Oct 9, 2026) · CEPR analysis of 2025 SCF public data (Oct 13, 2026) · Federal Reserve SHED press release (May 13, 2026)
Methodology note: the SCF interviews a dual-frame sample (an area-probability sample plus a list sample that oversamples wealthy families); “families” are the survey unit, race/ethnicity follows the respondent, and age/education follow the reference person. DFA shares are in current dollars and are not inflation-adjusted. Dollar gaps between group medians are arithmetic on the bulletin’s Table 2.
Share on
Twitter Facebook LinkedIn☕ Buy me a coffee! 💝
If you found this article helpful, consider buying me a coffee to support my work! 🚀